How to use PHP X-Ray to find out what is slowing down your site?
If you find that your website is slow, the causes can be multiple and difficult to analyze, which is why we provide you with a tool, PHP X-Ray, that allows you to detect what may be slowing down access to your PHP website. This tool is located in the "Software" section of your cPanel. PHP Xray
PHP X-Ray is a tool designed to monitor website performance and detect performance issues. It collects and displays information about slow scripts, external requests, and database queries from websites. Thanks to this, you will know exactly which query takes the most time on your website.
We recommend having your website developer accompany you to analyze these results.
Step 1: Start the analysis
- Disable any cache plugin on your website
- Click the Start tracing button to create a new analysis.
- In the popup that opens, enter the domain and path of the website to analyze (enter * in the "Specify mask" field to analyze all pages):
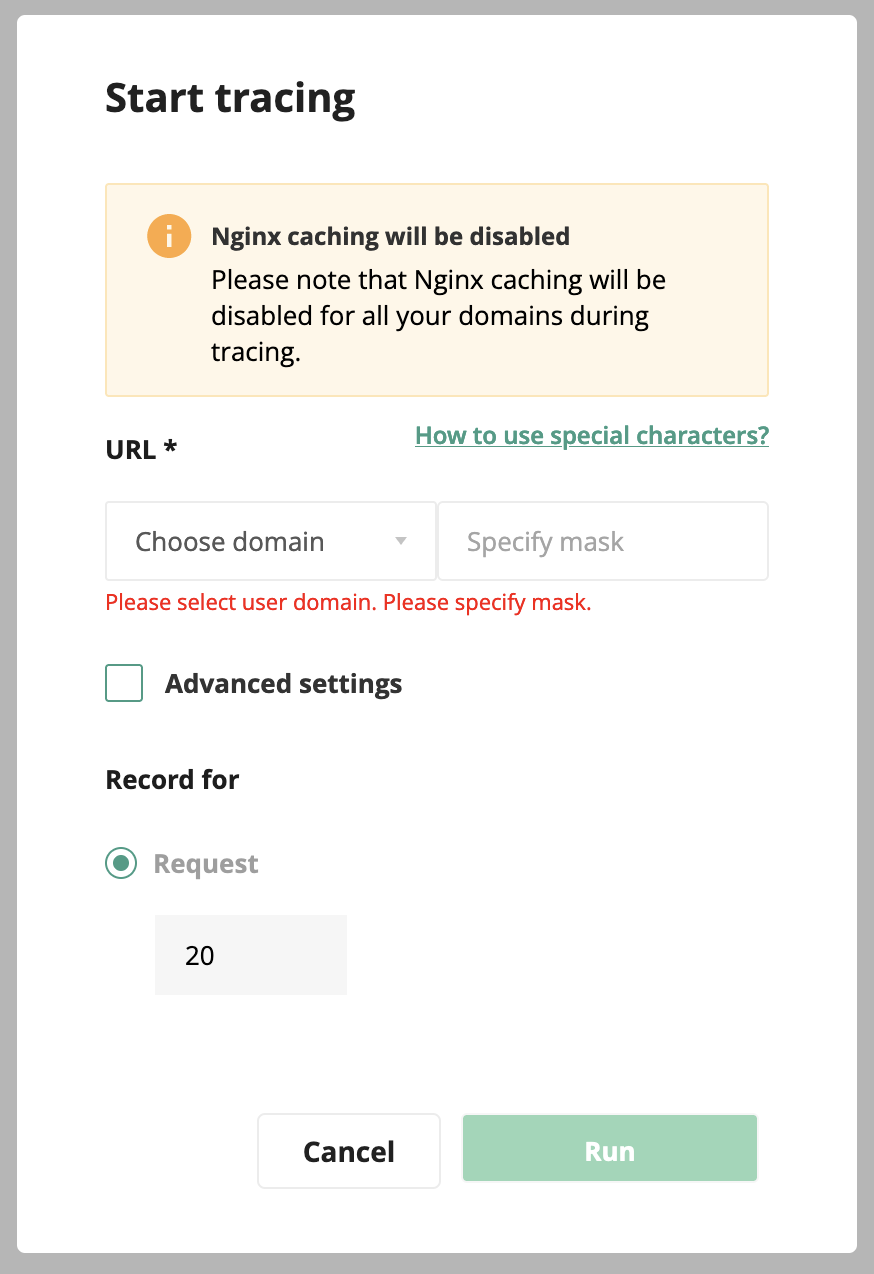
- You can specify how many requests to analyze using the "Request" field.
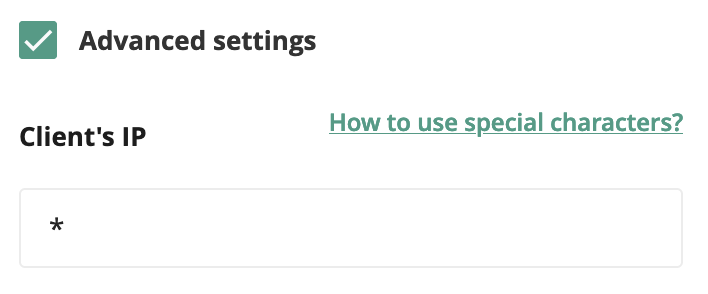
- You can restrict the requests to analyze to your IP address by checking the "Advanced settings" box and entering your IP address in the "Client's IP" field:
- Press the Run button.
Step 2: Analyze the results
In the "Tracing tasks" area, you have access to the latest analyses:
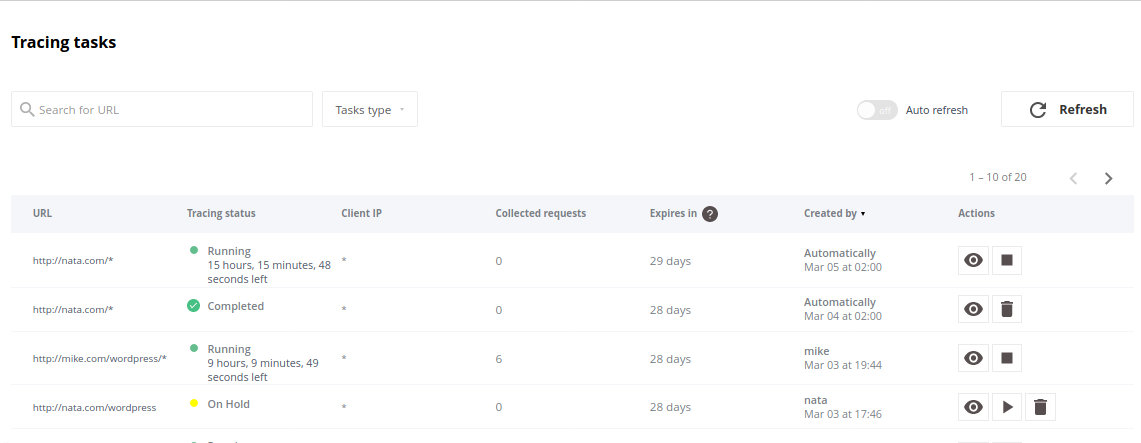
Analyses can have different statuses:
- Running: the analysis is in progress
- Stopped: the analysis was manually stopped
- On hold: an analysis for this address has already been requested, it will not be started automatically, you need to click the "▶" button to start it
- Completed: the analysis is finished
You can view the results of an analysis by clicking on the eye-shaped icon:
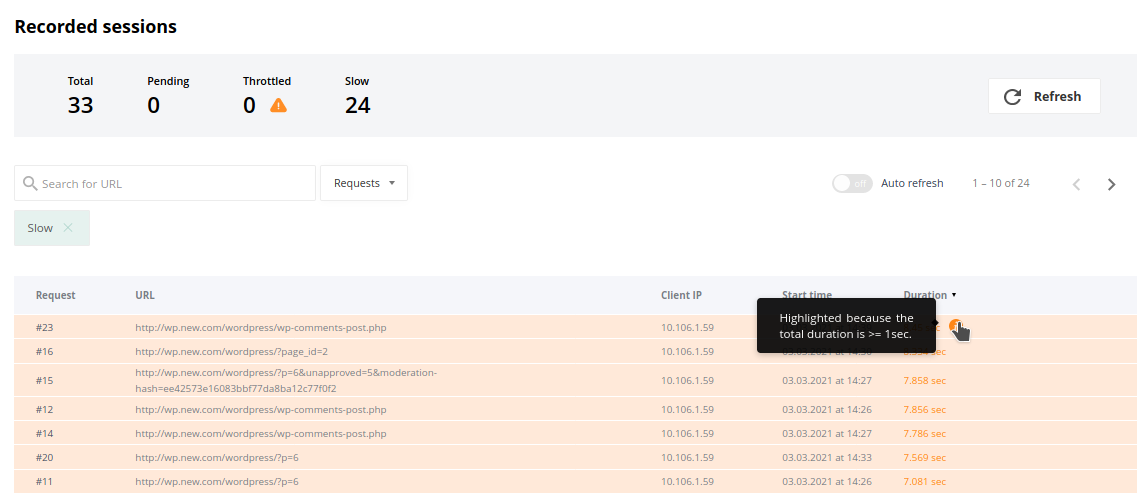
The summary at the top of the page shows the following information:
- Total: total number of requests in the analysis.
- Pending: number of ongoing requests that have not yet been counted.
- Throttled: number of requests that were slowed down due to a lack of resources on your hosting.
- Slow: number of requests exceeding one second.
You can click on one of the requests for more details to allow you to analyze the cause of slowdowns with precision: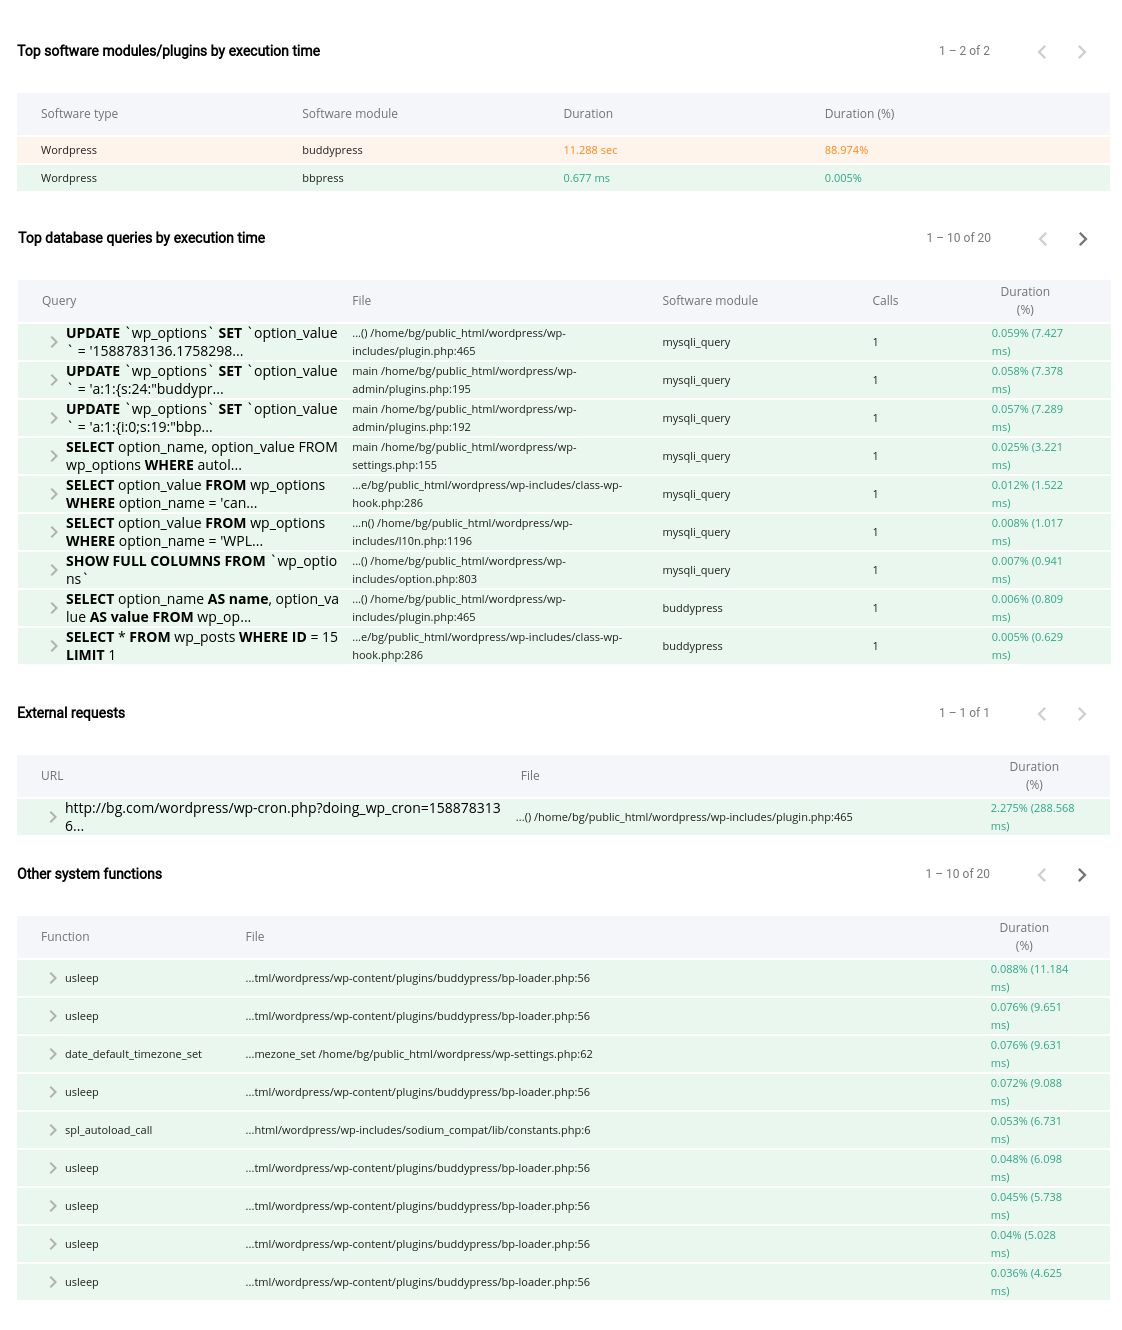
Tips:
- if you have an external request that is abnormally long and uses an unusual port (different from 80 or 443), it is probably a block at our firewall level. You can contact our technical support to learn more and they can open access if applicable.
- if you are using WordPress, you may be able to use AccelerateWP on your website.
Updated on: 21/02/2026
Thank you!