
My website is slow: how do I identify what's slowing it down with PHP X-Ray?
When a website is slow, the causes are often multiple and hard to isolate. That's why we provide a tool, PHP X-Ray, which precisely detects what's slowing down access to your PHP site. You'll find it in the "Software" section of your cPanel.
PHP X-Ray monitors your site's performance and identifies bottlenecks. It collects and displays information about slow scripts, external requests (calls your site makes to other services), and database queries. The result: you know precisely which request is taking the most time on your site.
We recommend getting support from your site's developer: they're the one who can fully interpret these results and act on them.
Step 1: run the analysis
- Temporarily disable any caching plugin on your site (caching would hide the real processing times).
- Click Start tracing to create a new analysis.
- In the window that opens, enter the domain and path of the site to analyze. Enter
*in the Specify mask field to analyze all pages: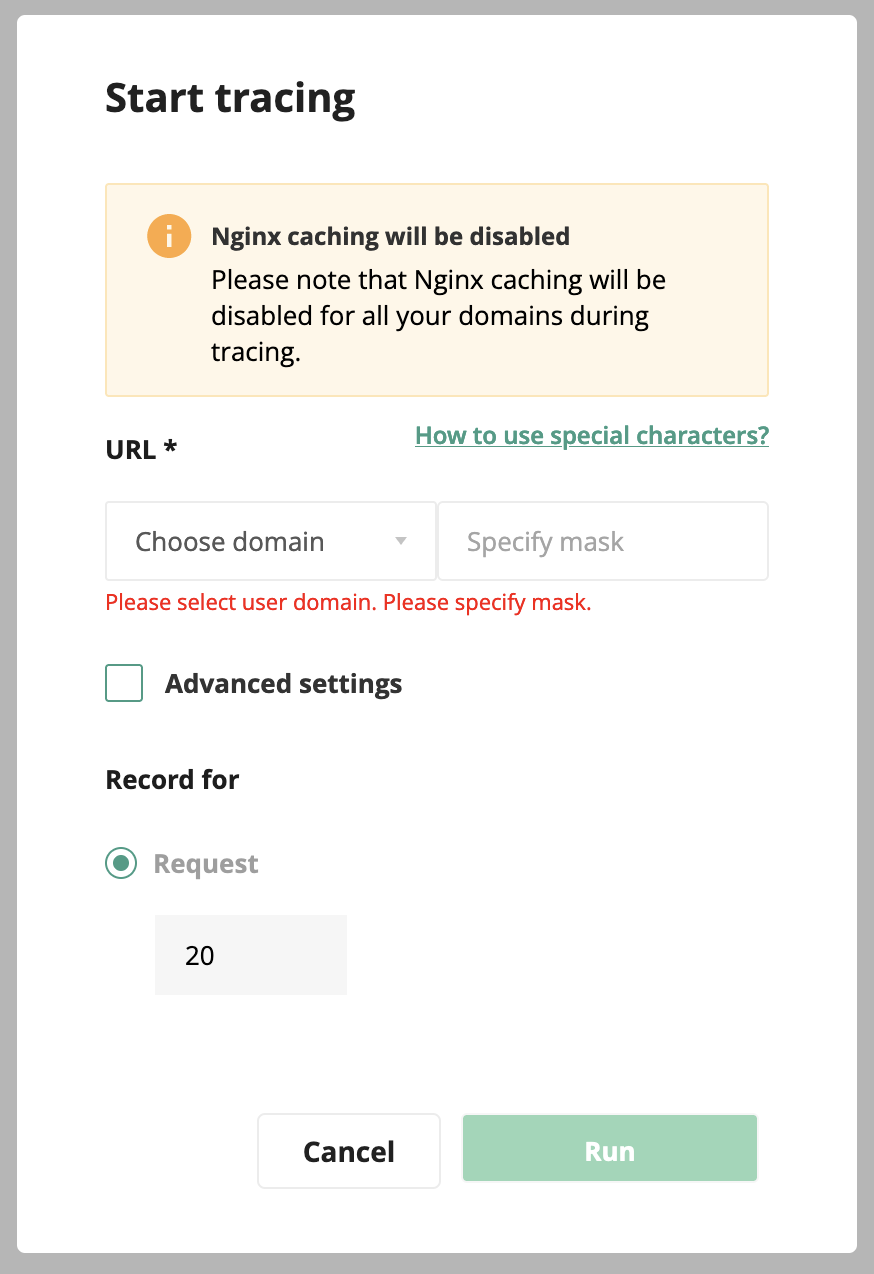
- The Request field lets you define how many requests to analyze.
- You can limit the analysis to your own IP address by checking Advanced settings, then entering your IP in the Client's IP field (useful to only record your own visits):
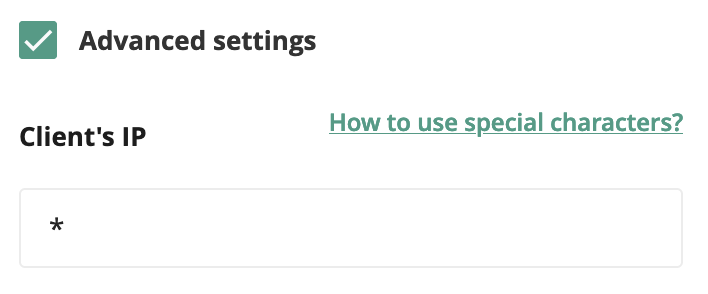
- Click Run.
Step 2: analyze the results
In the Tracing tasks area, you'll find your latest analyses:
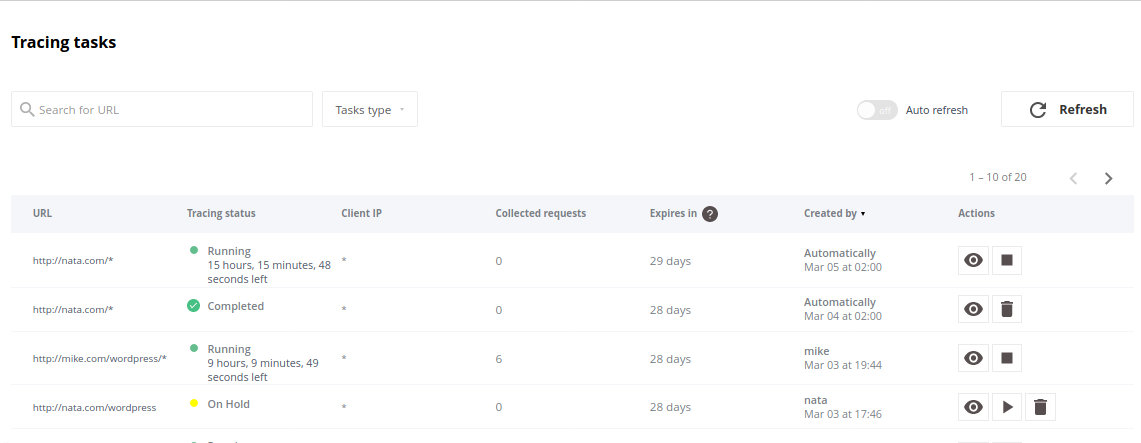
An analysis can display one of the following statuses:
- Running: the analysis is in progress.
- Stopped: the analysis was stopped manually.
- On hold: an analysis for this address has already been requested; it doesn't start automatically. Click the ► button to start it.
- Completed: the analysis is finished.
To view the results of an analysis, click the eye-shaped icon:
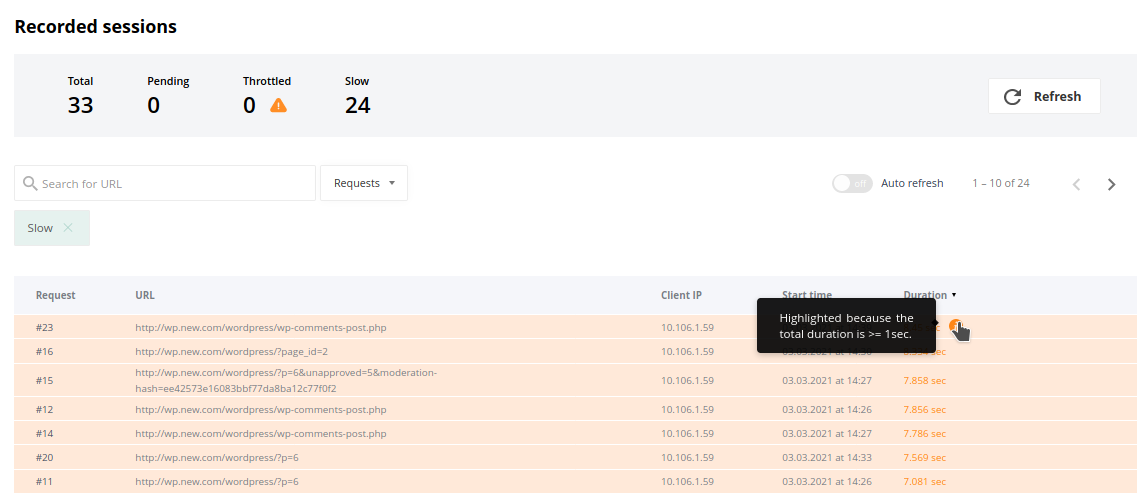
The summary, at the top of the page, shows:
- Total: the total number of requests in the analysis.
- Pending: the number of requests still in progress, not yet counted.
- Throttled: the number of requests that were slowed down due to insufficient resources on your hosting.
- Slow: the number of requests that took over one second.
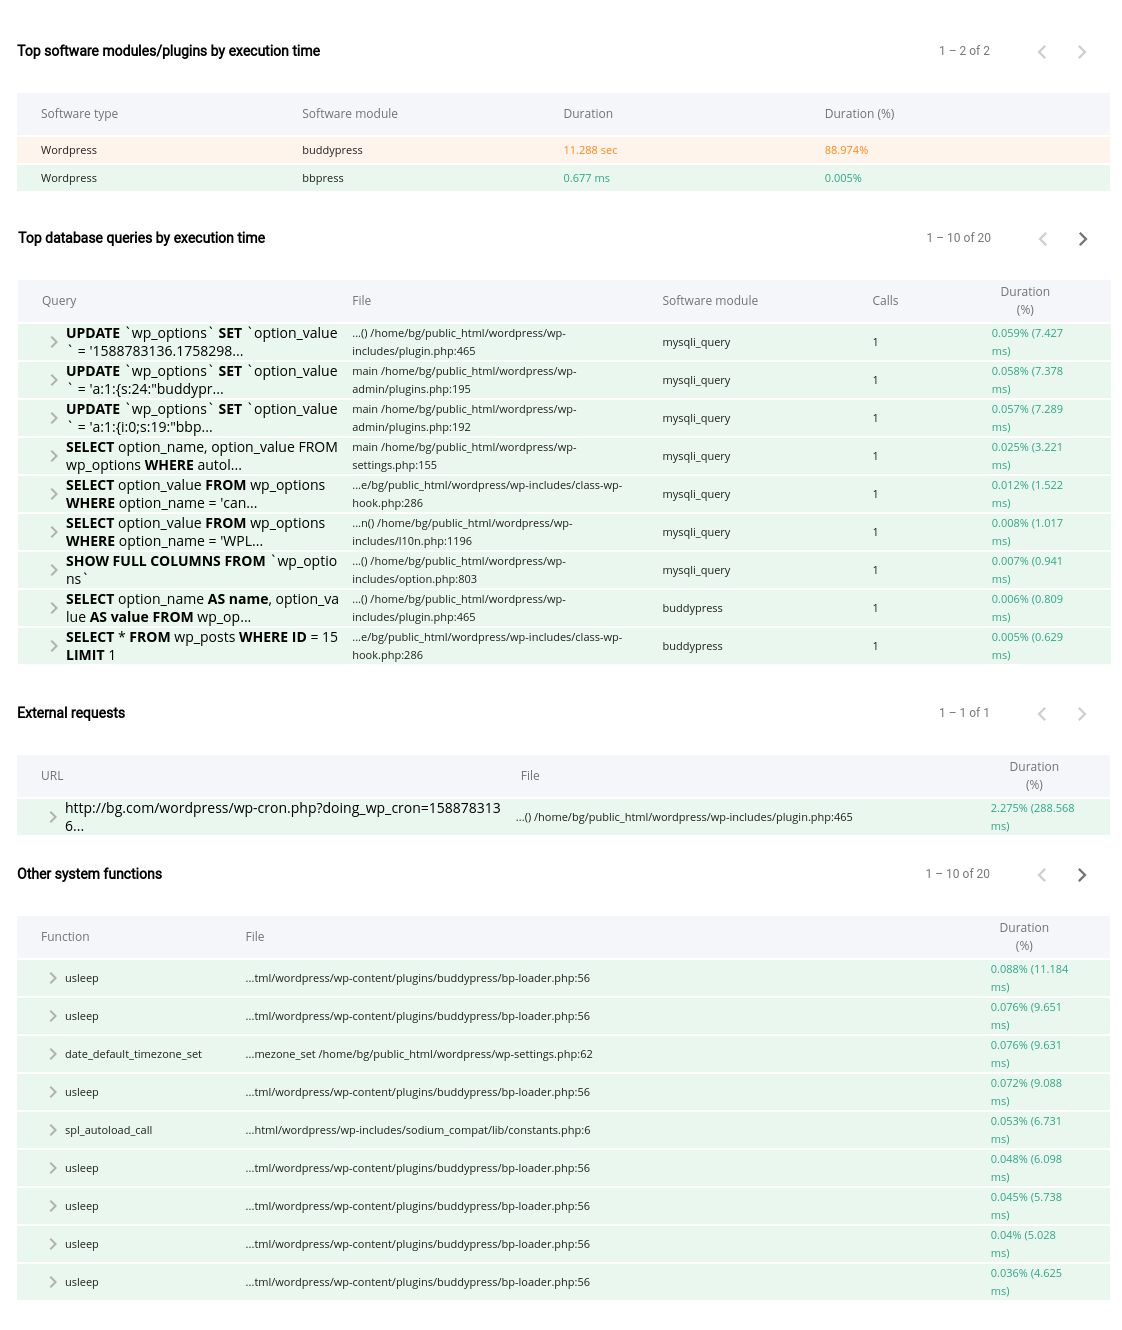
Click a request to display its details and trace the exact cause of the slowdown:
Tips:
- If an external request is abnormally long and uses an unusual port (other than 80 or 443), it's probably being blocked by our firewall. Contact our technical support: we can tell you more and open access if needed.
- If you're using WordPress, AccelerateWP can help speed up your site.
Updated on: 17/07/2026
Thank you!